MANILA, PHILIPPINES, 01 SEPTEMBER 2014: When it comes to shopping for grocery items, Filipinos still prefer the traditional ‘bricks and mortar’ experience, according to the report released today by global information and insights company, Nielsen.
The Nielsen Shopper Trends Report reveals that 93 percent of Filipinos enjoy grocery shopping in-store, and eight in 10 like to take their time and browse all parts of the store when they do their grocery shopping.
“The love for shopping is alive among Filipinos. They find joy in going up and down the aisles to check out grocery items. Retailers can further intensify the in-store shopping experience by offering a pleasant store environment,” says Lou-Ann Navalta, Nielsen’s Shopper Insights leader in the Philippines. “When shoppers are at ease, they are likely to come back to the store. This also makes them more receptive to in-store marketing efforts like promotions or impulse purchases.”
Shopper Trends is a syndicated annual report that Nielsen conducts across 54 markets globally. It provides a comprehensive overview of retail environment trends and an understanding of shopping behavior across the different trade channels. It provides insights on where, when, and how often people shop, and their emotional commitment and perceptions about key modern trade retailers.
With the proliferation of supermarkets across the Philippines in recent years, having convenient access to stores is less of a concern for shoppers. Increasingly, Filipino shoppers’ primary driver of store choice is their ability to fulfil all of their shopping needs in one location. Factors affecting shoppers’ in-store experience are also playing an increasingly important role in influencing store choice, including ease of finding what they are looking for, organized product displays, good customer service and a pleasant store environment (See Chart 1).
“As the number of supermarkets expands and shoppers’ needs evolve, it is no longer sufficient for retailers to rely on convenience factors alone to drive store choice,” notes Navalta. “Having a wide network of stores is just a minimum requirement nowadays, and to be chosen over others retailers need to become a one-stop shop and offer shoppers a pleasant and enjoyable shopping experience. This shift in shopper attitude extends to manufacturers too, and there is an opportunity for manufacturers to contribute to the shopping experience through shelf displays, category adjacencies, secondary placement and other in-store activations.”
While Filipino shoppers opt for an in-store experience when shopping for groceries, in contrast, they are avid users of online retail channels when it comes to purchasing non-consumable items.
According to the latest Nielsen Global Survey of E-Commerce, Filipinos are increasingly going online to purchase travel services and tickets for events such as movies, live performances, exhibitions and sports games. More than half of online Filipinos (55%) intend to buy airline tickets/reservations online within the next six month, while 46 percent plan to make hotel reservations and 37 percent intend to purchase event tickets online. Globally, Singaporeans have the highest online purchasing intention for airline tickets and hotel and tour reservations, and second highest globally for event tickets. (See Chart 2).
“The growth of connected device ownership is changing the way shoppers research and purchase the products and services they need and want,” observes Navalta. “We can expect this trend to continue on its ascent in the coming years as Filipinos become more comfortable with and more trusting of online retail sites.”
Digital consumers in the Philippines are among the most-inclined to purchase items online along with Vietnamese and Singaporeans, while Indonesians, Malaysians and Thais are more likely to go online to browse. Reading online reviews, product research and checking out products to inform their offline purchases rank among the main factors motivating Filipinos to go online to shop. (See Chart 3).
“Since many shoppers are browsing online before purchasing offline, retailers must ensure that they make digital a part of their overall engagement strategy,” Navalta advises. “Across the region, mobile apps and discount alert apps are beginning to gain traction with consumers, and offer an ideal opportunity for retailers to build an online connection with their customers.”
Credit card security remains a key concern across the region with five of the six Southeast Asia markets ranking above the global average with respect to their concern around providing credit card information online. Filipinos are the most cautious when it comes to paying online by credit card (67% do not trust giving their credit card information online), followed by Thais (62%), Indonesians (60%), Vietnamese (55%), Malaysians (52%) and Singaporeans (41%), compared to 49 percent of consumers globally.
“It is important for online retailers to set up a secure payment facility to reassure shoppers and gain their trust,” Navalta states.
When it comes to devices most frequently used to shop online, although PCs dominate in the majority of Southeast Asia markets, use of mobile phones for online shopping is growing in popularity across the region. The Philippines, Indonesia, Vietnam and Thailand rank in the top 10 markets globally for use of a mobile phone to shop online and all Southeast Asia markets scored above the global average. Tablet usage is also gaining traction as a means of accessing online retail sites, with all Southeast Asia markets except Singapore ranking above the global average for use of a tablet to shop online. (See Chart 4).
“Identifying and understating evolving shopper demands empowers retailers to respond with appropriate tactics and to use the right channel to engage with the right shopper,” emphasises Navalta. “By understanding the behaviour and sentiments of shoppers, retailers will be well-placed to build a lasting connection with them.”
CHART 1: TOP 10 DRIVERS TO SUPERMARKET CHOICE
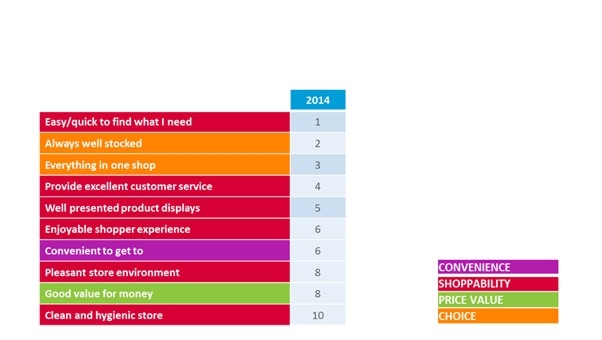
Source: Nielsen Shopper Trends, 2014
CHART 2: INTENTION TO PURCHASE PRODUCTS/SERVICES ONLINE IN NEXT SIX MONTHS (TOP THREE CATEGORIES)
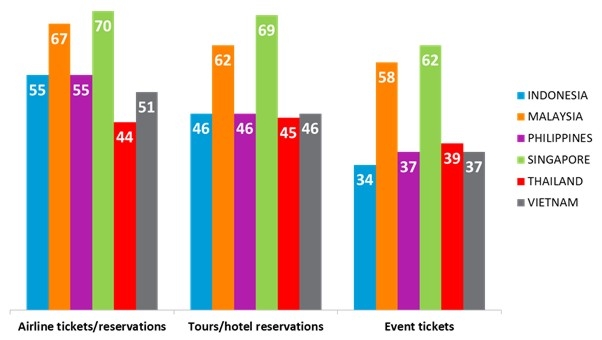
Source: Nielsen Global Survey of E-Commerce, Q1 2014
CHART 3: TOP THREE DRIVERS OF ONLINE SHOPPING
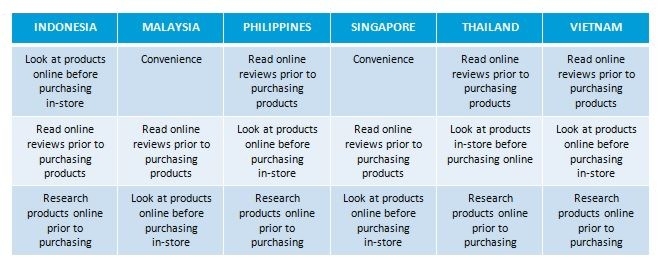
Source: Nielsen Global Survey of E-Commerce, Q1 2014
CHART 4: DEVICE USED MOST FREQUENTLY TO SHOP ONLINE
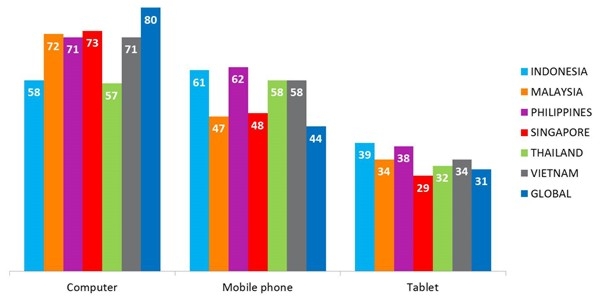
Source: Nielsen Global Survey of E-Commerce, Q1 2014
![[Industry Survey]](https://pana.com.ph/wp-content/uploads/GLOBE-1-400x250.jpg)